Case (4) Macro-financial data analysis
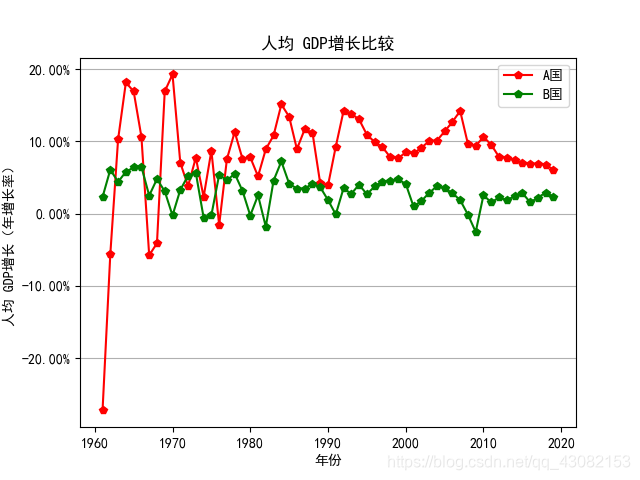
Project 1: Comparison of GDP per capita growth rates between country A and country B over the last 40 years using macroeconomic data provided by the World Bank Open Data Platform (graphical output)
The data is available via the download link in this webpage: https://data.worldbank.org.cn/?locations=CN-US

# -*- coding: utf-8 -*-
"""
Created on Mon Sept 22 9:11:59 2020

@author: mly
"""
import matplotlib.pyplot as plt
import matplotlib as mpl
import numpy as np
import pandas as pd
from matplotlib import ticker

plt.rcParams['font.sans-serif'] = ['SimHei']
mpl.rcParams["axes.unicode_minus"] = False

df = pd.read_csv('gdpchinaseries.csv')
df2 = pd.read_csv('gdpusaseries.csv')
y = df['gdp']
y1 = df2['gdp']
x = [x for x in range(1961,2020)]

ymajorFormatter = ticker.FormatStrFormatter('%.2f%%') # Set the format of the y-axis label text

plt.figure()
ax = plt.gca()
plt.grid(axis="y")
plt.title('人均 GDP增长比较')
plt.ylabel('人均 GDP增长(年增长率)')
plt.xlabel('年份')
ax.yaxis.set_major_formatter(ymajorFormatter) # Show percentage
ax.plot(x, y, '-rp', lw = 1.5, label = 'A国')
ax.plot(x, y1, '-gp', lw = 1.5, label = 'B国')
ax.legend(loc = 'upper right')


plt.show()
Results of the run.